Coordinates and Projections of Geographical Data
While working on a navigation tool I had to review some key topics in map projections, and I realized there wasn’t a single, concise resource for a quick refresher on the subject, so I put together this document to cover the basics in a simple and easy-to-follow way. Hopefully, it saves you some time and makes the topic easier to understand.
Introduction
Map coordinate systems and map projections are essential for accurately representing geographic data. A coordinate system defines a framework for locating points on a map, usually through latitude and longitude, while map projection converts the Earth’s three-dimensional surface into a two-dimensional map, introducing some level of distortion. Understanding these concepts is crucial for working with geospatial data, and without implementing them correctly, one might encounter unexpected issues. This guide provides an overview on those topics in a more practical manner.
The Complexity of Locating Things on Earth
Unfortunately, the Earth is not flat. Nor is it completely round. The Earth is an irregularly shaped ellipsoid [1]. When trying to look at Earth on a 2D surface such as a map (physical or on a monitor), we need to flatten this shape. Imagine peeling an orange, and organizing the peels on a table in such a way that can describe the entire orange as a whole. Pretty problematic, right?
Looking at any map, some level of distortion exists, due to the fact that we use 2D tools to describe a 3D shape. Those distortions can affect many things, such as distances, shapes, sizes, etc.
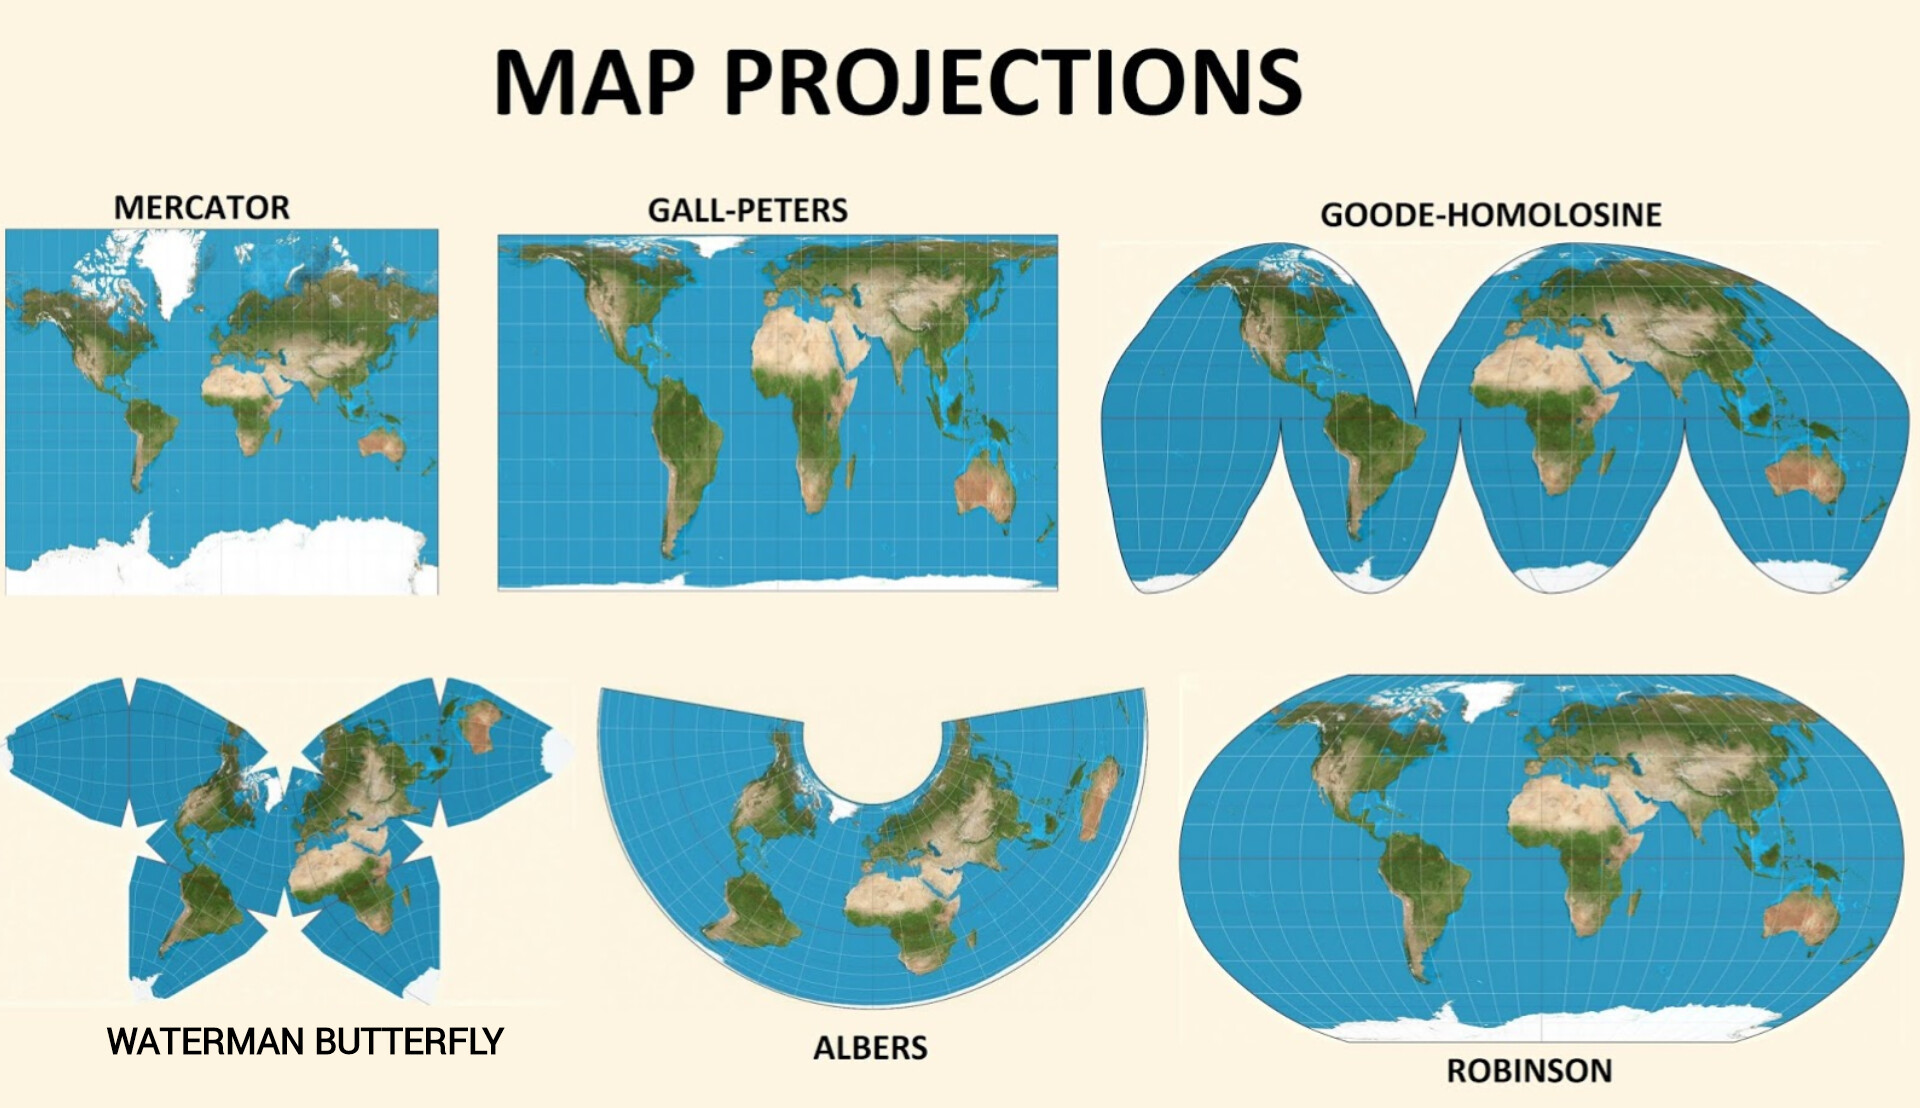 http://practicalgeoskills.blogspot.com/2020/04/map-projections-meaning-and-examples.html [6]
While on our day-to-day tasks we usually won’t care about such things, when trying to write software that uses geographical information, those inconsistencies might result in an accumulated error that will cause unexplained bugs, or an overall broken integration between systems.
Geodetic Datum
If we take the roughly-ellipsoid shape of earth as a simplified version, geodetic datum is a mathematical model describing this shape. While it may sound simple enough, this model has changed over the years, and currently, as a standard, GPS devices are using WGS 84 [2]. Historically, there were additional coordinate systems, some of them are even still used today. A good example is ED50, which although less accurate, some old documents still use it.
Going a bit into details, WGS 84 (short for “World Geodetic System”, where the number indicates the year of definition - 1984), answered a need for a more accurate model following the WGS 72. WGS 84 models the Earth as an oblate spheroid, meaning it’s slightly wider at the equator than from pole to pole, and it’s accurate up to 1-2 meters. The key measured parameters it is based on are [4] :
- Semi-major axis (a): 6,378.137 km (equatorial radius)
- Semi-minor axis (b): 6,356.752 km (polar radius)
- Flattening (f): f=(a−b)a≈1/298.257223563
And the coordinates are defined as:
- Latitude: Measured from the equator (0°) to the poles (90°).
- Longitude: Measured east or west from the Prime Meridian (0°).
Since the coordinates are angular units we usually treat them as planar units as well, where the latitude is moving along the Y axis, and the longitude along the X axis. The really irritating part is that some infrastructures are working with coordinates as X,Y values, as in longitude, latitude (e.g. OSRM), and some are the other way around (e.g. Google Maps), so always take a look at the documentation of the API you’re using!
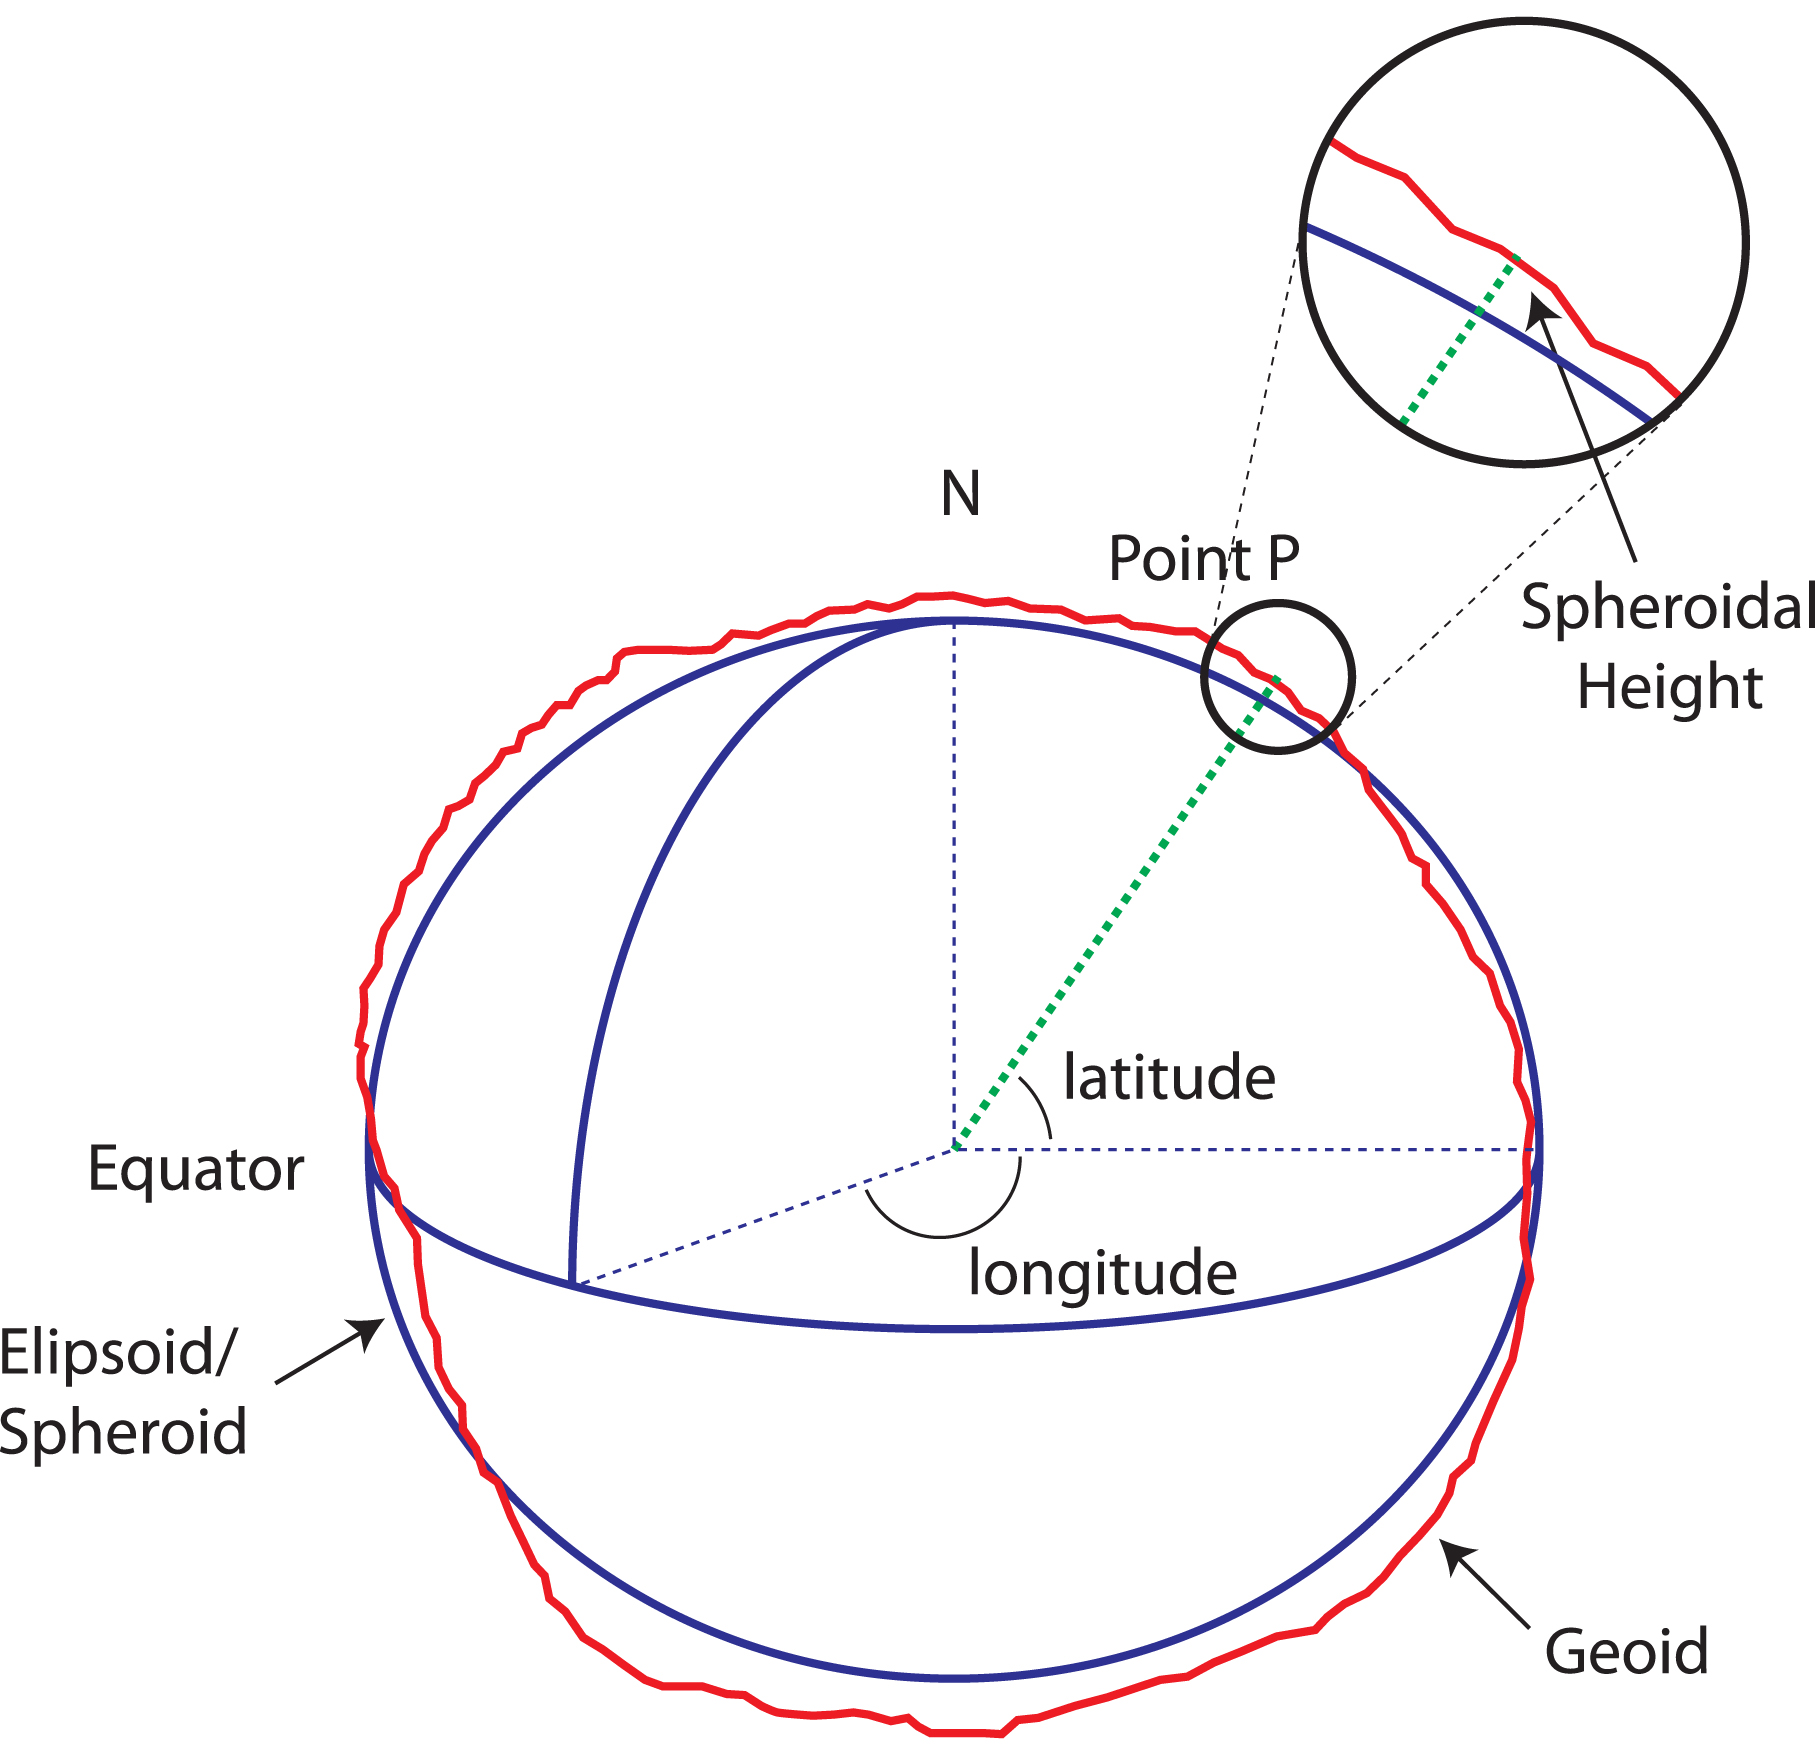
https://www.icsm.gov.au/sites/default/files/inline-images/spheroid_height_0.jpg [3]
Assuming we have all of that information, we can calculate the distance pretty easily using the Haversine formula.
Haversine Formula
The Haversine formula is a way to calculate the shortest distance between two points on a sphere, like the Earth, using their latitude and longitude coordinates. The formula is derived from a broader concept in spherical trigonometry called the law of Haversines, which helps us understand the relationships between the sides and angles of triangles drawn on a sphere’s surface.
# Code shared on StackOverflow, link in [5]
from math import radians, cos, sin, asin, sqrt

def haversine(lat1, lon1, lat2, lon2):
	"""
	Calculate the great circle distance in meters between two points
	on the earth (specified in decimal degrees)
	"""

	# convert decimal degrees to radians
	lon1, lat1, lon2, lat2 = map(radians, [lon1, lat1, lon2, lat2])

	# haversine formula
	dlon = lon2 - lon1
	dlat = lat2 - lat1

	a = sin(dlat/2)**2 + cos(lat1) * cos(lat2) * sin(dlon/2)**2
	c = 2 * asin(sqrt(a))
	r = 6371000

	return c * r
The Haversine formula uses the angles created by latitude and longitude coordinates to estimate the distance between the points. As you’ve probably noticed, the Earth’s radius we’ve mentioned before doesn’t match the one in the formula. This is caused by the underlying assumption of the formula that Earth is a sphere, so slight radius change is expected, which is also why this formulation will have some error embedded into it, since the underlying shape is incorrect. Using this formulation results in an 0.5% error, due to the changes of radius across Earth.
Let’s see a simple example of the differences between the Haversine formula and using map projection over specific territory. We’re working under the assumption that a map projection over a limited space can result in more accurate distance measurements, we’ll use that to measure the error (which is the absolute difference in this case). In this experiment, I’ve sampled points in a bounding box around Israel, and then measured the distance from the northernmost point to all other points, both using Haversine and the projected coordinates. Then, I used the difference between the two as an absolute error.
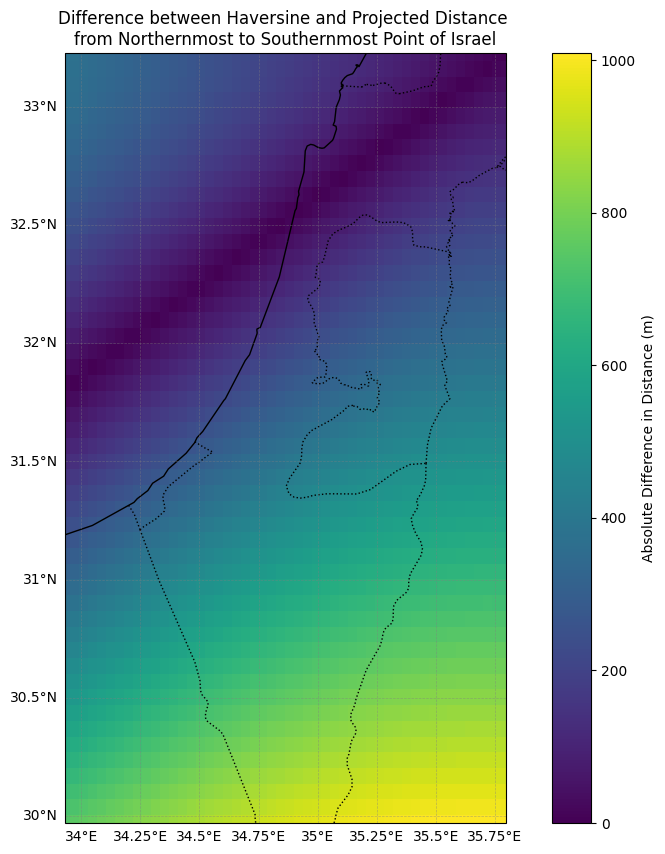 As presented, the further we go from the measured point, the larger the error in the Haversine formula.
Map Projection
Since we want our measurements to be correct, let it be distances, shapes or angles, we need to use some kind of a method or projection that allows us to modify the map while keeping those properties. But the thing is, there is no such a way. As I’ve mentioned, we’re trying to describe more than we’re capable on a 2D surface. The closest we can get is to choose some of the properties, and try to keep them correct.
The different types of properties that projections are trying to maintain are [7] :
- Conformal - preserving shape, or local angles, but not necessarily lengths.
- Used when mapping boundaries or other detailed features.
- Equal-area - preserving the areas on the map proportion compared to the area on Earth.
- Used when mapping properties that are tied to an area, such as population density.
- Equidistant - preserving the distance between points
- Used when mapping small areas, or when trying to get simple portrayals of the world without accurate data.
- Azimuthal - preserving the directions from the center of the map
- Used on point-to-point communication, when trying to understand which way an antenna should point.
Basically, a datum defines the shape of the Earth, while a projection is the method of flattening that shape onto a map.
Many resources can help you choose the right projection for your project; for example, Projection Wizard suggests the best option based on your area of interest (bounding box) and the properties you want to preserve. But this article had a specific agenda in mind when it was written, and that is calculating distances on a country level, and you’ve probably already guessed that this country is Israel, which is quite small.
Country-Level Map Projection
When trying to define the bounding box for your country on projectionwizard.org, it mentions very helpful advice:
For maps at this scale, you can also use the state’s official projection. Most countries use a conformal projection for their official large-scale maps. You can search for official projections by area of interest in the EPSG Geodetic Parameter Dataset.
When you focus on a relatively small region, using some local projection will be the most accurate one you can use. The EPSG Geodetic Parameter Dataset centralizes all those local projections in one place and allows you to query them in a convenient way. It also mentions the usages of each one, and the revision date which is important since those projections are getting updates from time to time.
Once you select the projection you want to use, implementing it in Python can be done in various ways. I’ll show a couple of quick examples using GeoPandas, which is a very common package to perform geo-spatial analysis, and another more generic way through pyproj, which is more coordinates-projection focused.
Code Example
Coordinates Generation
So first, let’s create some coordinates in a specific polygon. Since we’re using a local projection the coordinates can’t be anywhere we want; they have to be within the selected region.
import random
from shapely.geometry import Point, Polygon

def generate_points_in_polygon(polygon, num_points):
    points = []
    minx, miny, maxx, maxy = polygon.bounds
    while len(points) < num_points:
        x = random.uniform(minx, maxx)
        y = random.uniform(miny, maxy)
        point = Point(x, y)
        if polygon.contains(point):
            points.append(point)
    return points

# Polygon inside of Tel-Aviv, Israel
boundary_polygon = Polygon([[34.7692287, 32.0656649], [34.7689390, 32.0612824], [34.7754943, 32.0612188], [34.7754729, 32.0669105], [34.7692394, 32.0656649]])

# 3 points is just about enough for this example
n_points = 3
original_points = generate_points_in_polygon(boundary_polygon, n_points)

print(f'Original Coordinates: {original_points}')
Setting CRS
Then, we set the input CRS and output CRS. In terms of terminology, CRS refers both to geodetic datum, which in this case is the EPSG:4326, which is the aforementioned WGS 84, and the projected coordinates EPSG:2039, which is the projection in meters for coordinates in Israel.
input_crs = 'EPSG:4326'
output_crs = 'EPSG:2039'
PyProj Transformation
from pyproj import CRS, Transformer

pyproj_input_crs = CRS.from_user_input(input_crs)
pyproj_output_crs = CRS.from_user_input(output_crs)

x_values = [x.x for x in original_points]
y_values = [x.y for x in original_points]

pyproj_projection_x, pyproj_projection_y = Transformer.from_crs(pyproj_input_crs, pyproj_output_crs, always_xy=True).transform(x_values, y_values)

pyproj_projection = [(x, y) for x, y in zip(pyproj_projection_x, pyproj_projection_y)]
print(f'PyProj Projected Coordinates: {pyproj_projection}')
GeoPandas Transformation
gdf = GeoDataFrame(geometry=original_points, crs=input_crs)

gdf = gdf.to_crs(output_crs)

geopandas_projection = [(point.x, point.y) for point in gdf.geometry]
print(f'GeoPandas Projected Coordinates: {geopandas_projection}')
Results
Here is an output example (which isn’t consistent, since we’re randomizing the points in the polygon):
Original Coordinates: [<POINT (34.773 32.065)>, <POINT (34.774 32.061)>, <POINT (34.774 32.063)>]
PyProj Projected Coordinates: [(178714.52500834814, 663613.8859131511), (178841.61001940715, 663212.3942785999), (178830.23080959407, 663332.992697638)]
GeoPandas Projected Coordinates: [(178714.52500834814, 663613.8859131511), (178841.61001940715, 663212.3942785999), (178830.23080959407, 663332.992697638)]
Summary
Representing our round Earth on flat maps involves choosing the right way to “squash” it down, as no method is perfect and some features will always be distorted. We use coordinate systems to pinpoint locations, and different map projections prioritize different properties like accurate shapes or areas. For local work, specific country or regional projections often give the best results. Thankfully, tools and software help us convert between these systems to ensure our measurements and analyses are as accurate as possible.
Resources
Obligatory XKCD
https://xkcd.com/977/
References
[1] https://oceanservice.noaa.gov/facts/earth-round.html
[2] https://en.wikipedia.org/wiki/World_Geodetic_System
[3] https://www.icsm.gov.au/education/fundamentals-mapping/datums/datums-explained-more-detail
[4] https://en.wikipedia.org/wiki/Earth_radius
[5] https://stackoverflow.com/a/4913653
[6] http://practicalgeoskills.blogspot.com/2020/04/map-projections-meaning-and-examples.html
[7] https://geo.libretexts.org/Bookshelves/Geography_(Physical)/Introduction_to_Geography_(McCormick)/01%3A_Physical_Geography/1.04%3A_Map_Projections